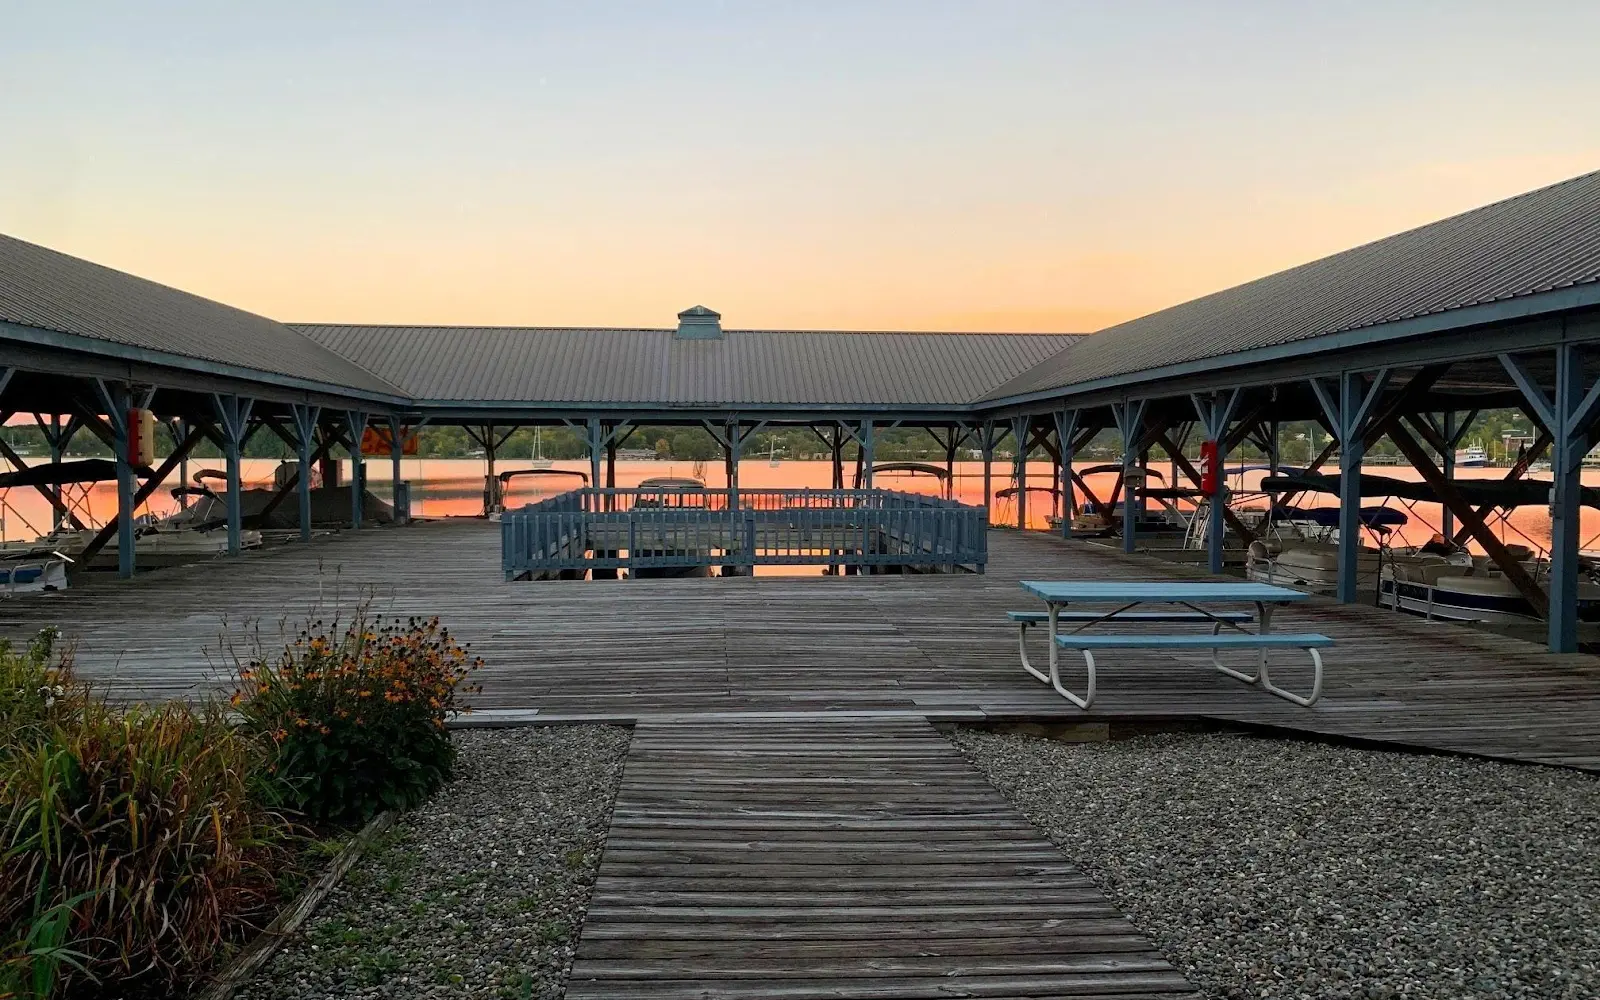
Newport Marine Service Waterfront
About
Gallery
Operator details
- Vessels
- Powerboat
Boater reviews
Rating from Google.
Around here
Around Newport Marine Service Waterfront
Source: USGS GNIS · Source: Canadian Geographical Names Database (NRCan), Open Government Licence - Canada · Public land: USGS PAD-US
Typical flow by month
1909 to 2026
The water at Newport Marine Service Waterfront typically runs highest in April, at a median 608 cfs, and lowest in September, at 99 cfs. The highest flow on record for any single day is 3,740 cfs, in 2011.
Show the numbers
| Month | Typical (cfs) | Usual range (cfs) |
|---|---|---|
| January | 167 | 119 to 240 |
| February | 140 | 98 to 197 |
| March | 214 | 137 to 376 |
| April | 608 | 449 to 906 |
| May | 408 | 275 to 558 |
| June | 214 | 137 to 303 |
| July | 121 | 80 to 202 |
| August | 104 | 62 to 177 |
| September | 99 | 62 to 155 |
| October | 131 | 88 to 216 |
| November | 218 | 146 to 306 |
| December | 216 | 149 to 309 |
Typical is the median of each month’s daily median values, and the usual range runs from the median 25th to the median 75th percentile, across about 110 years of record. Statistics published by the US Geological Survey for Clyde River at Newport, VT (site 04296500). Conditions on any given day can fall well outside the usual range. Check the current reading before you go.
Current conditions
Today · Fri
75Go/ 100
CloudyHigh 61°F, low 49°FRain 54%Wind 5 kt, gusts 20
Streamflow
56 cfs
Much below normal (5th)
Water level
3.13 ft
Forecast from Open-Meteo global models (NOAA & ECMWF). See full conditions →
More charters


Also nearby
Other ways to get outside within about an hour of here.


Free tools