San Diego Boat Tours
About
Gallery
Operator details
- Vessels
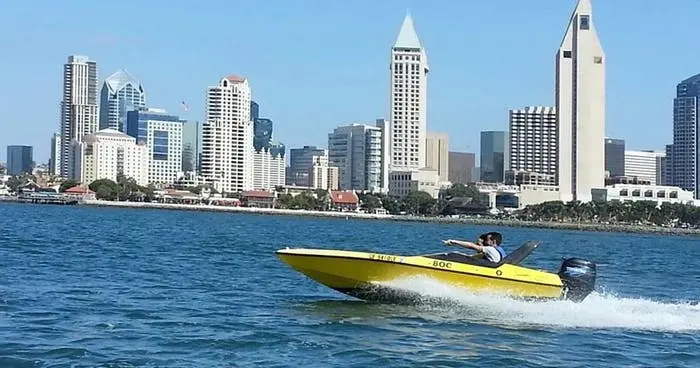
- Powerboat
Boater reviews
Rating from Google.
Around here
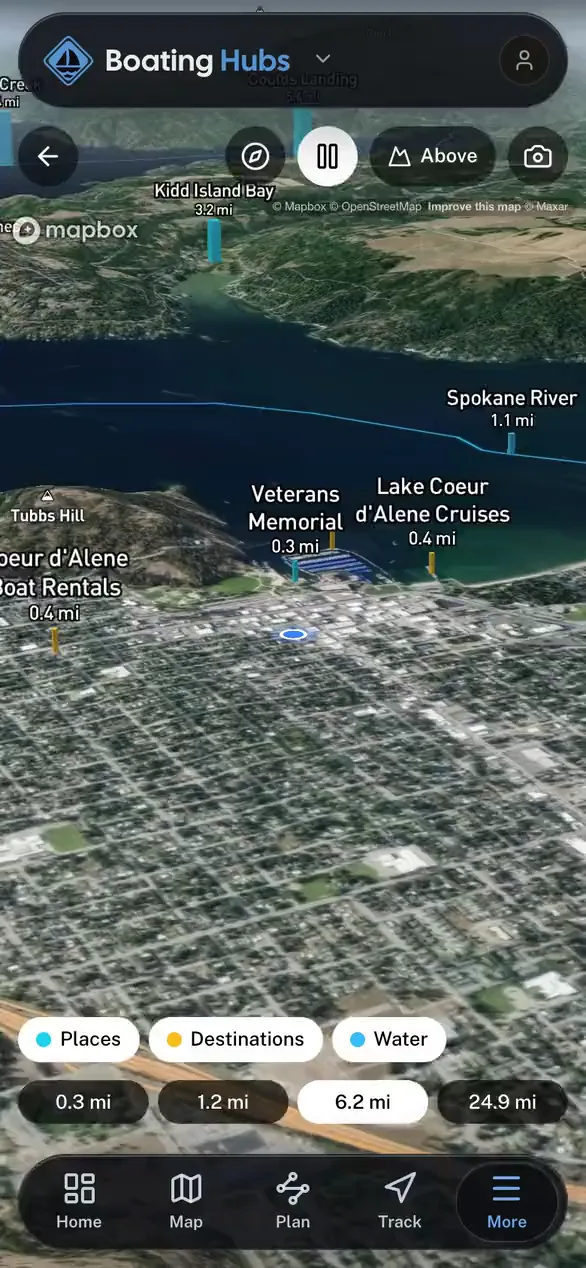
Around San Diego Boat Tours
- Visitor Center and View BuildingVisitor center3.3 mi (opens in a new tab)
- Cabrillo National MonumentRecreation area3.5 mi (opens in a new tab)
- San Diego Bay National Wildlife RefugeRecreation area8.5 mi (opens in a new tab)
- Tijuana River National Estuarine Research ReserveRecreation area11.4 mi (opens in a new tab)
- Otay Mountain WildernessRecreation area23.9 mi (opens in a new tab)
Data Source: Recreation.gov · Source: USGS GNIS · Public land: USGS PAD-US
Typical flow by month
1982 to 2026
The water at San Diego Boat Tours typically runs highest in March, at a median 27 cfs, and lowest in August, at 1.4 cfs. The highest flow on record for any single day is 5,800 cfs, in 2011.
Show the numbers
| Month | Typical (cfs) | Usual range (cfs) |
|---|---|---|
| January | 17 | 9.4 to 52 |
| February | 27 | 12 to 71 |
| March | 27 | 13 to 67 |
| April | 13 | 7.1 to 32 |
| May | 6.2 | 3.6 to 13 |
| June | 3.4 | 1.8 to 5.7 |
| July | 1.7 | 1.0 to 2.7 |
| August | 1.4 | 0.9 to 2.2 |
| September | 1.4 | 0.9 to 2.1 |
| October | 1.8 | 1.2 to 3.7 |
| November | 5.3 | 1.7 to 14 |
| December | 14 | 7.2 to 37 |
Typical is the median of each month’s daily median values, and the usual range runs from the median 25th to the median 75th percentile, across about 44 years of record. Statistics published by the US Geological Survey for San Diego R at Fashion Valley at San Diego CA (site 11023000). Conditions on any given day can fall well outside the usual range. Check the current reading before you go.
Current conditions
Today · Sun
80Go/ 100
ClearWaves 3.7 ft86°FRain 0%Wind 7 kt, gusts 15
Waves
3.4 ft @ 10s
Wind
7 kt
Gusts 15 kt
Water
75°F
Air
78°F
Streamflow
12 cfs
Above normal (76th)
Water level
2.52 ft
Air quality
30 Good
San Diego - Sherman Elementary School monitor, 7 km
National Weather ServiceBelow flood stage
Flood stage 10 ft. NWS reads 2.51 ft here.
NWS forecast: 2.5 ft by Sun 7 PM, below flood stage.
Tides
Rising
High 4.2 ft at 8:48 PM
Predicted at San Diego, Quarantine Station, 2 km away.
Get a 2027 tide calendar for this stationForecast from Open-Meteo global models (NOAA & ECMWF). Flood stages and forecasts: NOAA National Weather Service. Air quality: San Diego APCD via EPA AirNow. Preliminary data, not verified. Tide predictions: NOAA CO-OPS, feet above mean lower low water. See full conditions →
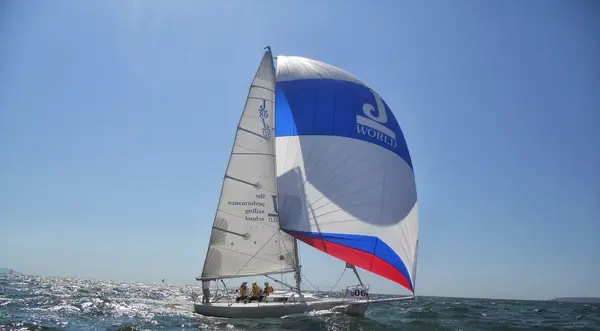
More charters in California
Also nearby
Other ways to get outside within about an hour of here.

Free tools